What Investors Are Actually Looking At and How to Present It
Raising venture capital is partly a translation exercise. Founders live inside the operational reality of their business. Investors encounter that reality through a compressed set of numbers, narratives, and assumptions presented over a small number of meetings. Metrics are the bridge between those two perspectives.
A founder may understand why customer acquisition costs temporarily increased, why margins compressed during a product transition, or why churn rose in one segment while expanding in another. Investors do not initially have that context. They interpret the business through the signals a founder chooses to present and the clarity with which those signals are explained.
This is why metrics matter beyond financial reporting. They shape whether investors perceive a company as disciplined or reactive, durable or fragile, scalable or operationally constrained.
The purpose of this guide is not to encourage founders to optimize presentation over substance. Investors eventually uncover the underlying reality of a business. Instead, this guide explains how experienced investors interpret startup metrics across three distinct moments in the company-building journey:
- The pitch, where founders establish credibility and potential.
- Diligence, where investors test whether growth is structurally sound.
- Board reporting, where communication shifts from persuasion to accountability.
The same metric can communicate something entirely different depending on the context in which it appears. Understanding that distinction is one of the clearest markers of financial maturity.
Part I: The First Meeting — Metrics That Open the Conversation
A founder walks into a Series A pitch meeting. Their company has reached $1.5M ARR, revenue has doubled year-over-year, and customer logos are recognizable. On paper, the business appears promising. Within minutes, investors begin asking different questions:
How durable is this revenue?
Is growth accelerating or slowing?
Can the business scale efficiently?
What happens if acquisition costs increase?
Although it’s clear the pitch deck is not a financial archive, rather a structured argument that the company has the characteristics required for venture-scale outcomes.
At this stage, investors are not looking for exhaustive detail. They are trying to answer a narrower question: does this company deserve deeper investigation? Which if it does, you know your pitch has done it’s job correctly.
ARR and Growth Rate: Evidence of Momentum
For subscription and SaaS businesses, ARR is usually the starting point. ARR measures the annualized value of recurring revenue:
ARR = MRR \times 12
ARR is frequently confused with bookings, total contract value, or total revenue. These metrics capture different aspects of company performance and should not be presented interchangeably. ARR specifically reflects recurring revenue that is currently active and expected to continue.
Growth rate gives ARR context. Investors rarely evaluate ARR as a static number. They examine the trajectory behind it.
A company growing from $500K ARR to $2M ARR within twelve months communicates fundamentally different from a company that required four years to reach the same figure. Growth velocity matters because venture investing depends on businesses that can compound quickly.
The early trajectory of Snowflake became compelling partly because revenue growth consistently outpaced expectations while large enterprise customers expanded their usage over time. Investors were not responding only to absolute revenue. They were responding to the combination of rapid expansion and evidence that revenue quality was improving alongside scale.
Founders should avoid presenting ARR as an isolated snapshot. A twelve-month trend line communicates far more than a single figure on a slide.
Gross Margin: The Economics of Scale
Revenue growth alone is incomplete. Investors also want to understand whether the business becomes more efficient as it scales.
Gross margin measures the percentage of revenue remaining after direct delivery costs are removed:
Gross\ Margin = \frac {Revenue - COGS} {Revenue}
In software businesses, high gross margins signal operating leverage. Once the product is built, additional customers can often be served at relatively low incremental cost.
For infrastructure-heavy businesses, the interpretation differs. A logistics platform or marketplace may operate with structurally lower margins. In those cases, investors focus more closely on whether margins improve over time.
This distinction became particularly relevant in discussions surrounding Uber during its growth years. Investors debated not only top-line expansion, but whether the company could eventually improve contribution margins while maintaining network liquidity across markets.
A founder presenting improving margins signals something important: the company is learning.
Burn Rate and Runway: The Timing Question
Every fundraising conversation is also a discussion about time.
Burn rate measures monthly net cash outflow. Runway measures how long the company can continue operating at the current burn rate before capital runs out.
Investors interpret these metrics strategically, not emotionally. A company with four months of runway enters fundraising with limited flexibility. A company with eighteen months can negotiate more deliberately and maintain operational focus during the process.
The strongest presentations connect burn directly to milestones:
“We are burning $250K per month and expect this raise to fund expansion from $1.5M ARR to $4M ARR over the next 18 months.”
That framing communicates capital efficiency, planning discipline, and operational intentionality simultaneously.
Part II: Diligence — When Investors Test the Engine
If the pitch creates interest, diligence tests whether and how the underlying mechanics work.
At this stage, investors move beyond headline metrics and begin examining the structure beneath growth. The conversation shifts from “Is this company growing?” to “Why and how is this company growing, and can that growth continue?”
This is where unit economics become central.
CAC and LTV: Understanding the Acquisition Machine
Customer Acquisition Cost measures how much the company spends to acquire a customer:
CAC = \frac{Sales\ +\ Marketing\ Spend} {New\ Customers}
Lifetime Value estimates the cumulative gross profit generated by a customer relationship:
LTV = \frac{ARPU \times Gross\ Margin}{Churn\ Rate}
Investors rarely analyze these numbers independently. They study the relationship between them.
The LTV:CAC ratio helps determine whether customer acquisition is economically rational:
LTV:CAC = \frac{LTV}{CAC}
These metrics become especially important once companies begin scaling paid acquisition channels.
When Zoom expanded, its product-led adoption model reduced acquisition friction while strong retention expanded lifetime value. Investors may have interpreted this combination as evidence that growth could remain efficient even at increasing scale.
Founders should expect investors to examine CAC by channel and segment.
Retention: The Metric Behind Product-Market Fit
Retention is one of the strongest indicators that a product delivers recurring value.
Customer churn measures how many customers leave over time. Revenue churn examines the revenue impact of those departures. Net Revenue Retention incorporates expansion revenue from existing customers:
NRR = \frac{Beginning\ ARR + Expansion - Contraction - Churn}{Beginning\ ARR}
An NRR above 100% means the company can grow revenue from its existing customer base even before acquiring new customers.
This dynamic became central to the success narrative around companies such as Slack, where existing teams often expanded usage organically across departments and workflows after initial adoption.
Sophisticated investors rarely stop at aggregate retention numbers. They examine cohorts.
Cohort analysis reveals whether retention is improving across successive customer groups or whether growth is masking underlying instability. A business may appear healthy in aggregate while newer cohorts quietly deteriorate.
Founders who proactively present cohort weaknesses often build more credibility than founders who avoid discussing them entirely. Investors understand operational challenges. What concerns them more is incomplete visibility.
Exercise:
Before your next investor conversation, review your business using the following framework:
- Which three metrics currently define the company’s narrative?
- Which metric would an investor likely question first?
- If growth slowed by 30% next quarter, which underlying metric would explain why?
- Which operational assumption in your forecast is least validated by current data?
This exercise is useful because investors are rarely evaluating metrics in isolation. They are evaluating the consistency between numbers, assumptions, and strategic decisions.
Part III: After the Investment — Metrics Inside the Board Room
Once a company raises capital, the communication dynamic changes fundamentally.
The board is no longer deciding whether to invest. It is deciding whether to maintain confidence in the plan, support strategic changes, or allocate additional capital in future rounds.
The purpose of board reporting is therefore different from pitching. The goal becomes clarity, accountability, and alignment.
Strong board communication usually follows a simple structure:
- What the company planned to accomplish.
- What actually happened.
- Why the variance occurred.
- What management intends to do next.
Metrics become significantly more useful when embedded inside operational explanation.
Bookings, Billings, and Revenue
One recurring source of confusion in board discussions is the distinction between bookings, billings, and revenue.
Bookings represent signed contract value.
Billings represent invoiced cash.
Revenue represents recognized income under accounting standards.
These metrics often diverge meaningfully during periods of rapid sales expansion.
A company scaling enterprise sales may show accelerating bookings months before that momentum appears in recognized revenue. Conversely, weakening bookings can serve as an early warning signal before revenue growth visibly slows.
Investors track all three because they reveal different stages of commercial activity.
Operational Metrics and Strategic Alignment
The operational metrics that matter most depend on the company’s growth model.
A product-led company may prioritize activation rates, engagement, and product adoption. A sales-led company may focus on pipeline coverage, deal velocity, and expansion revenue.
The key principle is consistency between stated strategy and reported metrics.
If management claims that product adoption is accelerating, activation and engagement data should support that conclusion. If the company claims enterprise expansion is driving growth, NRR and average contract value trends should reflect it.
Metrics are persuasive only when they align coherently with the operational story being told.
NPS and Qualitative Context
Net Promoter Score is frequently cited but inconsistently interpreted.
An NPS score without context communicates very little. Sample size, customer composition, collection method, and qualitative responses all influence interpretation.
A score of 70 from ten highly engaged design partners means something very different from a score of 70 collected across thousands of paying customers.
The qualitative comments attached to NPS surveys often matter more than the numerical output itself because they reveal how customers actually describe the product’s value.
The Real Function of Metrics
Metrics do not replace judgment. They structure it.
An experienced investor rarely evaluates one KPI in isolation. ARR without retention can be misleading. High growth without margin discipline can become fragile. Strong retention with weak acquisition efficiency can constrain expansion.
The real skill lies in reading metrics collectively.
For founders, this means presenting numbers with context rather than performance theater. Investors do not require perfection. They require evidence that management understands the underlying drivers of the business and can respond intelligently when conditions change.
For investors and LPs, metrics serve a similar purpose at the portfolio level. Fund performance ultimately reflects the underlying quality of company economics: retention durability, capital efficiency, margin structure, and long-term expansion potential.
Metrics are therefore not the destination. They are instruments for navigating uncertainty.
At its core, venture capital remains an exercise in probabilistic decision-making under incomplete information. Metrics help reduce uncertainty, but they do not eliminate it. The companies that consistently earn investor confidence are not necessarily the ones with flawless numbers. They are the ones whose numbers form a coherent and credible narrative over time.
Quick Reference: Startup Metrics at a Glance
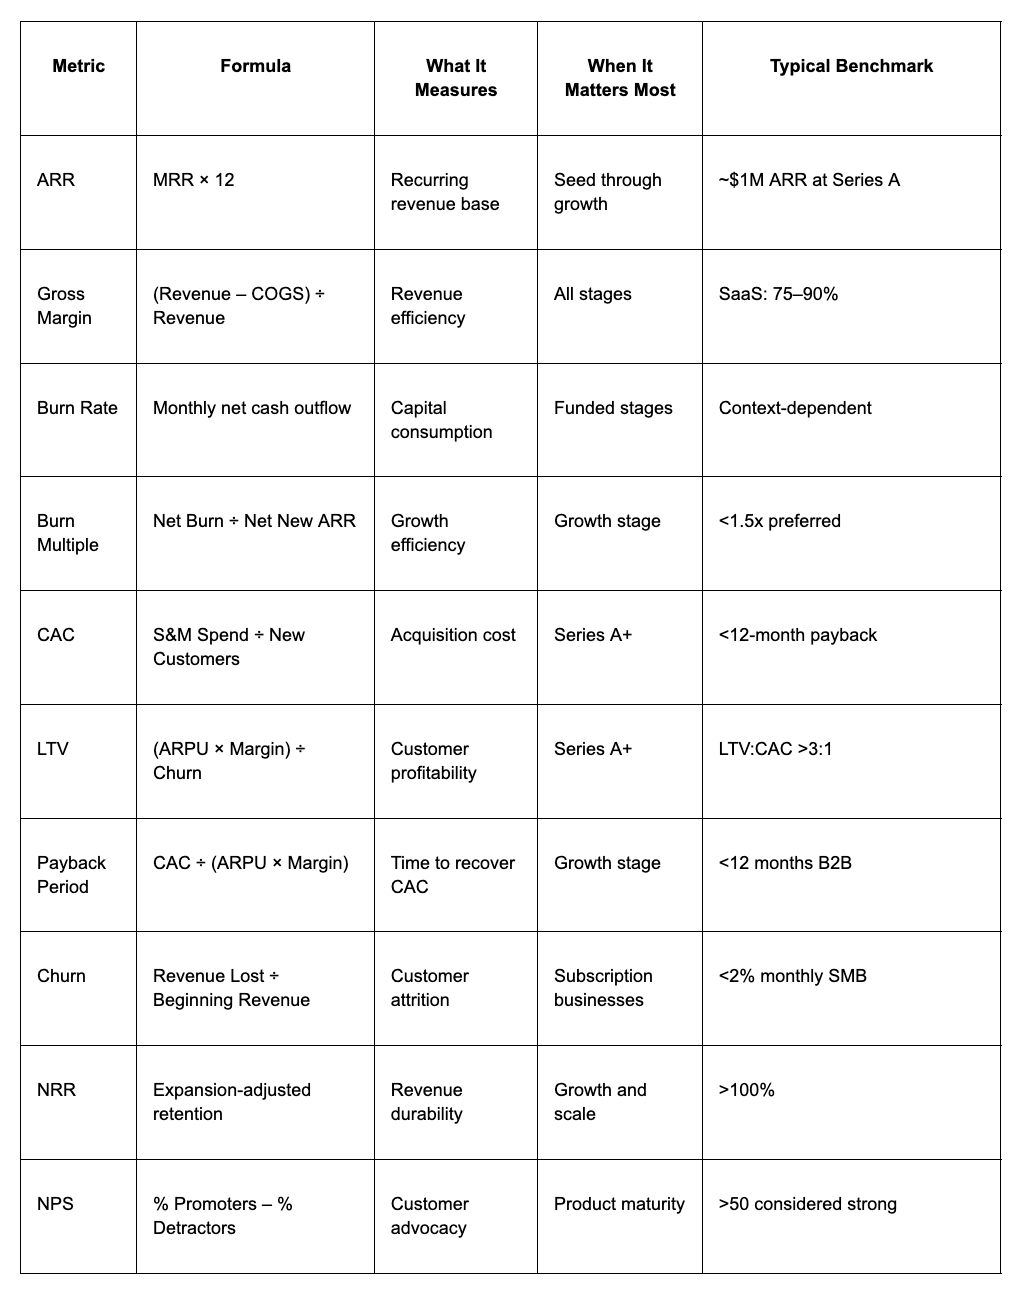
Both parts of this series draw on commonly referenced venture capital benchmarks. Metrics should always be interpreted relative to company stage, business model, geography, and market conditions. No single metric determines investment quality in isolation. The quality of interpretation matters as much as the numbers themselves.
Interested in the full research paper?
Join to receive Venture Capital research, guides, models, career tips, and many other great insights delivered straight to your inbox.